Wednesday, August 11, 2010

Shik Shin (U. Tokyo): Laser ARPES on (Ba1-xKx)Fe2As2 and BaFe2(As0.65P0.35)2


Introduction shows the phase diagram for BaFe2As2 to KFe2As2, indicating that the SC gap at optimal doping is isotropic with S+/- state (Ding EPL 2008), KFe2As2 apparently has nodes (and is d-wave)
Where does the gap symmetry change, exactly?

(Canfield) Samples in phase diagram seem to have large compositional uncertainty – will this be true in your study too?
(Shin) We will use single crystals.

The review continues to show that some pnictides have isotropic gap, others not. There is a significant spread in the values of gap relative to Tc, ranging from  1-8 (depending on which FS is selected and which material) . Kuroki suggests that the Fe-pnotogen height is a possible control variable which tunes from S+/- (large pnictogen height, Ba.6K.4Fe2As2) to d-wave when it is small (KFe2As2). An alternative view is that phonon assisted electron scattering between orbitals can explain the S+/- gap symmetry.

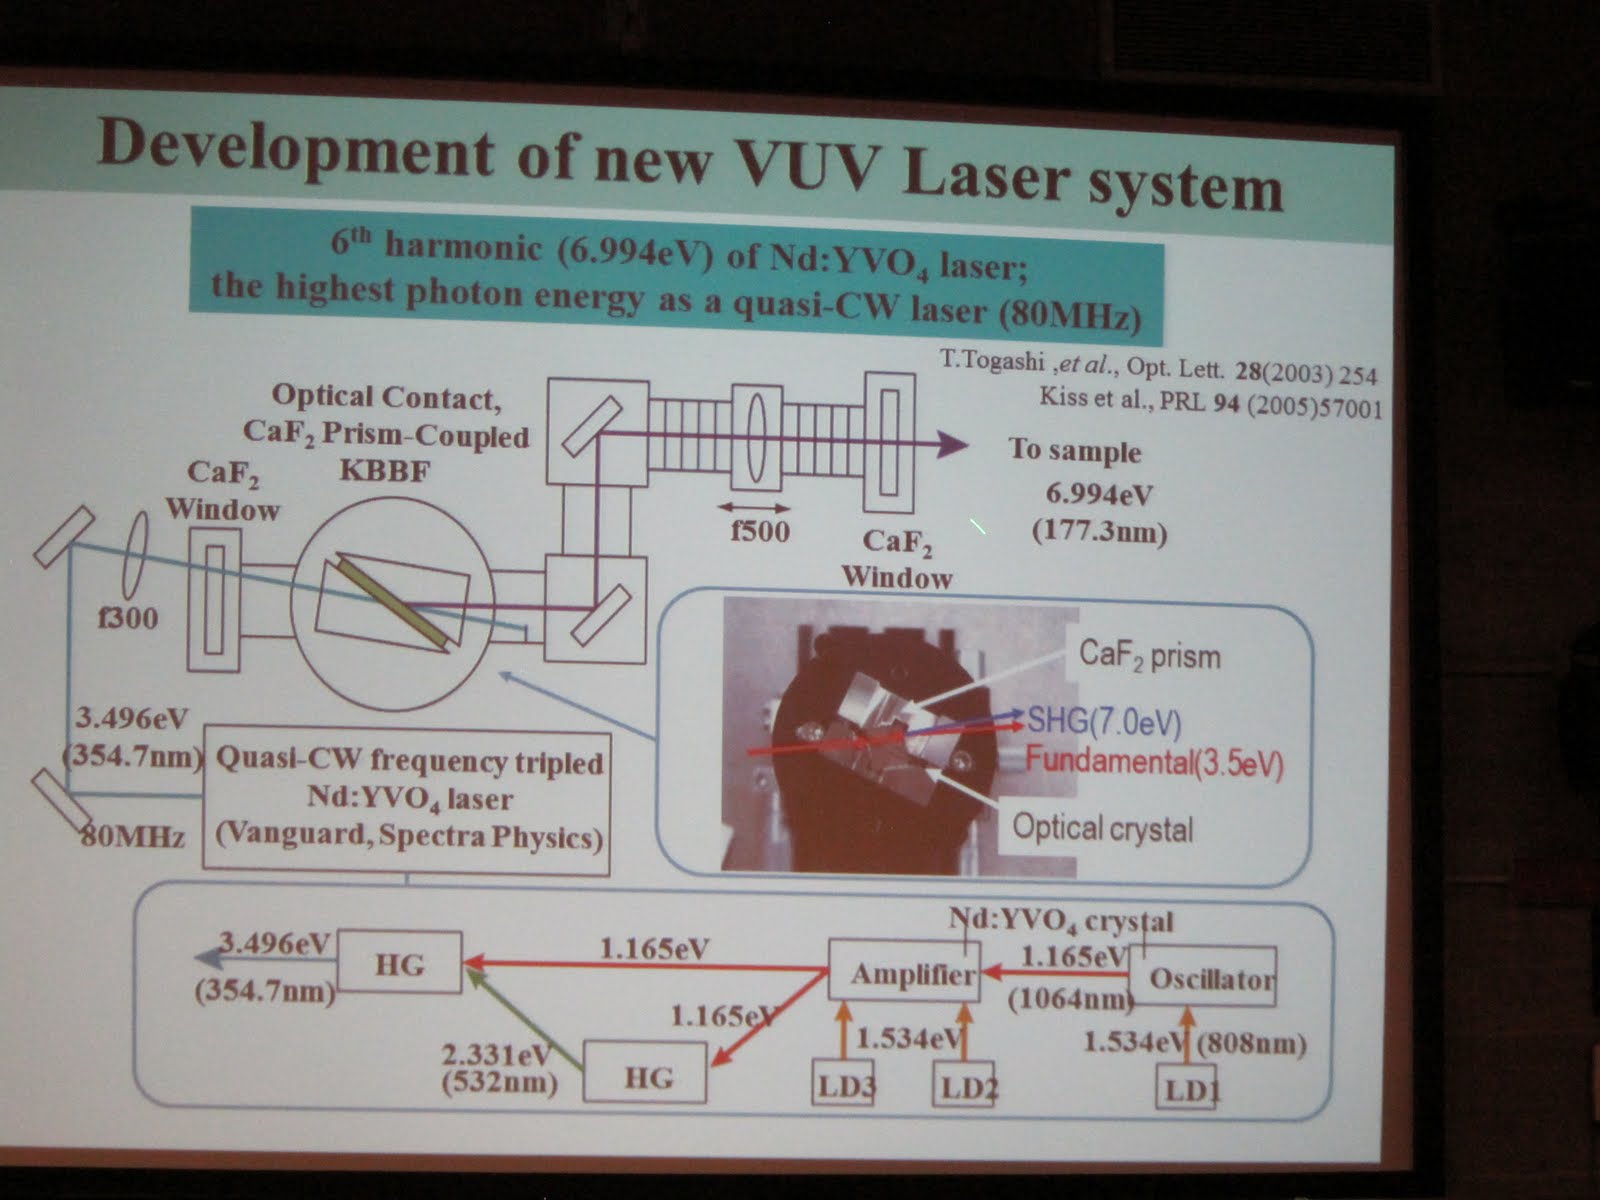
Shin then introduced a new VUV Laser-driven ARPES system at the University of Tokyo, where the high energy resolution is achieved by using a high harmonic of  7 eV Nd:YVO4 laser .  It is possible to do measurements at temperatures as low as 1.5 K, and with a resolution of~ 0.25 meV (not sacrificing a wide angular range).  A novel feature is the possibility of polarization analysis (linear or circular).  Resolution is dominated by the laser linewidth.  Conventional synchrotron based photoemission currently is greater than 1 meV, and is limited to T>15 K. So the new technique may be transformative to a range of problems.

(Coleman) What about the momentum resolution?
(Shin) It is not improved relative to conventional PES.
(Canfield) What is lowest TC SC that you have measured?
(Shin) K122, but we are now measuring a substance with TC=3 K.

This technique is also the most bulk sensitive form of PES, since the electron energies are less than 100 eV, and the escape depths as large as 100 angstroms.  Hard x-ray PES the escape depth is 10 angstroms.
7 eV laser limits the part of the Brillouin zone that can be accessed in the pnictides.
Measured 3 SC compositions (single crystals), study both temperature dependence and by varying polarization can zero in on different symmetry orbitals.

1.     Twinned domains in the low T phase related to transition from tetragonal to orthorhombic structures. Topological change in FS  in s-polarization: selection rules imply that the  electrons are  from dzx or dyz orbitals

(Canfield) What is spot size?
Shin: 100 microns
(Canfield) One domain or more?
Shin: Measurement averages over many  twins.

ARPES results are in reasonable agreement with LDA calculation by Oguchi (cylindrical above TN, 3-dimensional below)
>> Orbital-selective electronic  reconstruction across TN: FS has single component (dxz) below TN. Dyz component is gapped.   AF involves orbital ordering.
Now presentation of SC 122 system BaFe2(As.4P.6)2 (optimally doped) Find that FS is quite different for p and s polarization, and each sheet has different polarization., in agreement  with band calculations.

 (Nevidomski) Is this the same pi,pi pocket that was calculated by Kuroki?  Historically, the calculations only show two pockets. Could it result from folding at pi,pi point?
(Shin) The experiments are clear there are 3 Fermi surface pockets
(Chubukov) This will depend on the specific material.
Evidence is presented for a resonance mode at 12 meV (analog to spin resonance from neutrons?)and at 30 meV (a phonon?)
(Chubukov) Is there really a kink at 13 meV?  Perhaps it is a smooth crossover?
(Shin) There is a departure from linearity at 13 meV.

The SC gap has previously been measured in ARPES measurements, and they can now measure it for the different parts of the FS using the polarization analysis.  One band (hole band #1) has a 2-peak structure – small gap is 3 meV, 2D/kTC~2. Larger gap is found near M-points, and since it survives above the SC transition, it is not related to SC.  With proper symmetrization of the data, it is argued that the gap has a BCS-like temperature dependence, vanishing at ~35 K.  Other measurements have found a larger gap in this system. 
Larger gap peak is possibly related to the 10 meV spin resonance.

(Takagi)  Peak B (large gap ) narrows below Tsc – must have some relation to SC?
(Chubukov)  Peak B is OK for BCS gap, small gap is too small.
(Shin)  Peak B is not SC gap, since it only appears in the occupied states (Peak A is in both)
(Takagi)  it will depend on the polarization as to which gap you will observe. In this polarization this is what you see.
FS of all 3 FS sheets is square, but  with similar magnitudes (3 meV).  No nodes in any, but smallest in pi,0 directions   >> anisotropic s-wave?
(Tetsuo)  How about the angle dependence of gap?
(Shim) Don’t know
(Chubukov) What is the  largest gap?
(Shim) 3.2 meV along pi,pi

Now to 122 system BaFe2(As0.35P0.65)2 where there is more doping and a smaller pnictogen height. Hole FS is larger according to theory.  While parent compound has a single sheeted FS, this system has 3 FS sheets.
SC gap is BCS_like (TC=28 K) and the gaps are 3 – 4 meV. Again, not d-wave, prefer anisotropic s-wave. Not much difference in gap structure or magnitude among the 3 FS sheets. All are pinched in along pi,0 direction. Some evidene of coupling between orbitals, so need a more complicated explanation than `simple spin fluctuations’’.
Dr. Shin stresses the important role of orbital order in the SC state.  Gap/Tsc is always small compared to BCS ratio, and there is  no evidence from him measurements for nodes.
He identifies the following open questions:

1.What is the 10 meV peak?? What exactly is the possible connection to the spin resonance mode found in neutron scattering measurements?
2.What would the spin fluctuation theory look like if orbital ordering were included?
3. Where are the SC nodes in KFe2As2 parent compound?

(Nevidomski) Why does ARPES never seems to observe gap on electron pocket? Must one go to zone boundary (inaccessible to ARPES)?

(Shin) Yes, our photon energy does not allow us to reach this part of the zone.
(Chubukov) Is orbital order seen both above and below Tsc?
(Shin) We don’t have data above Tsc.
(Chubukov) Laser ARPES from China claims that there are more FS sheets in SC state than normal state. What about in your measurements?
(Shin) Only see one sheet is observed.
(Keimer) Low energy kink may not be related to resonance from neutron scattering. In electron doped cuprate system the mode follows the gap, and has the BCS temperature dependence.  Here it seems like the kink energy is temperature independent.
(Shin)There may be a weak temperature dependence.
(Nakatsuji) In P doped 122 some measurements indicate nodal structure but not yours. 
(Shin) We cannot measure at the endpoints, so direct comparison is not possible.
(Coleman) Is gap node not d-wave but perhaps a different sort of symmetry?
(Chubukov) S+/- is most likely.
(Chubukov)Can you see gaps on both  hole and electron FS?  What are the relative gaps? Ding claims to see a gap on the electron FS  - what about you?
( Buechner) We see a much bigger gap at gamma than this expt does. Perhaps this expt is more bulk sensitive.


Adam Kaminski (Iowa State/ Ames Lab): Competing ground states in cuprates: disentangling Cooper-pair formation above Tc from the pseudogap state

Introduction and Background

Adam started his talk introducing the ARPES technique: photons are incident in the sample and, as a result, electrons are emitted. These electrons are then detected and, from their momentum and energy, important information about the material can be extracted. In particular, Adam explained that the quantity measured by ARPES is the spectral function, multiplied by the Fermi function and the proper matrix element. He presented the experimental details of the technique and the instrumentation his group has been using to obtain data.

Adam also showed examples of ARPES intensity plots of doped BSCCO samples, explaining how one can extract the Fermi surface and the band structure from them. He also presented cuts in the intensity plot, which can give either EDCs (energy distribution curves) or MDC (momentum distribution curves). In superconducting (SC) samples, the SC gap can be extracted from the EDC, as a sharp peak appears below Tc.

Q (Andriy Nevidomsky): What is the difference between the data extracted by ARPES and STM?
A: They have similarities, but ARPES is able to give information about momentum dependence, particle lifetime.

Now, Adam is explaining how one can extract only the spectral function from the EDC data, eliminating the Fermi function factor. There are two possible approaches: divide the EDC by the Fermi function or symmetrize the curves (the latter is due to Mike Norman). Adam further explained the details of the symmetrization procedure and its suitability to extract gaps amplitudes.

Q: Does ARPES measure surface or bulk properties?
A: Surface properties, but in anisotropic materials like the cuprates they are expected to be similar.

[A discussion about particle-hole symmetry and the ARPES spectrum is taking place now, involving Andy Schofield, Andrey Chubukov and Adam]

Before going to the main topic of his talk, Adam explained that samples have a finite "laboratory lifetime", since they age due to CO2 absorption when vacuum is less than perfect.

Pseudogap in the cuprates

After showing us spectra from the cuprate SC Bi2212, Adam posed one of the main points of his talk: is the pseudogap in the cuprates a friend or a foe of superconductivity? He presented two different approaches in the current literature: one of them considers that the pseudogap state is due to pre-formed pairs (Emery and Kivelson). The other approach considers that the pseudogap is an ordered state (such as DDW, ordered dimers, CDW, persistent currents). Adam's proposal is to use highly precise ARPES data to shed light on this discussion.

The first set of data presented by Adam showed the angular dependence of the spectrum gap (extracted from the EDC) in OP (optimally doped) Bi2201 for a given temperature below Tc. The data, Adam argues, show significant deviations from a pure d-wave behavior. His proposal is that the spectral gap has actually two contributions: one from the actual SC gap and another from the pseudogap.

Still focusing on the spectral gap, Adam showed its detailed momentum dependence across the phase diagram. After comparing the spectral gap below and above Tc for UD (underdoped), OP (optimally doped) and OD (overdoped) samples, Adam showed that it has a very unusual temperature dependence, which is non-monotonic - another evidence for two gaps, he says. With these results, Adam motivates that the individual spectral weights, instead of the spectral gap, should be investigated in details, in order to obtain independent information about the PG (pseudogap) and the SC gap.

His group studied Bi2201 samples, focusing first on the properties of the spectral function at the antinode (i.e., fixing the momentum). They associate the coherent peak to the SC state and itsweight, to the superfluid density (he points out that no theoretical model gives this correspondence, it is an empirical observation). On the other hand, the loss of spectral weight at the Fermi level is a hallmark of the pseudogap, Adam says. With these two energy scales - namely, the coherent peak weight and the loss of spectral weight at Ef - Adam extracts independently the spectral weights associated to the PG state and to SC.

Now, Adam is presenting a systematic study of these two spectral weights below Tc for UD, OP, and OD samples across the Fermi surface. In particular, starting from the nodal point, he probes the weights along the Fermi surface by 45 degrees, until the antinodal point is reached. He showed plots with the PG weight increasing at the expense of a decrease in the SC weight across the Fermi surface (for the three different doping levels). Plotting these two weights in the same figure, one in each axis, Adam argues that his data imply an anti-correlation between them, concluding that the pseudogap is a foe of SC - i.e. they are competing states. He warned that these are indirect measurements, reflecting spectral properties. To support his interpretation, he showed penetration depth data, which is a direct measurement of the superfluid density.

Pre-formed pairs in the PG state

Adam has now switched to the next topic of his talk. He first presents Nernst effect data, which find local pairing in the cuprates above Tc. To probe local pairing with ARPES, Adam's proposal is to use the spectral function to extract the Fermi surface density of states, which should be sensitive to pair-breaking effects and local pairing. He also presented STM data, which shows evidence of SC patches above Tc.

Using the EDCs obtained by ARPES, Adam's group extracts the spectral weight at Ef (the Fermi energy). A linear behavior of this weight with temperature is observed at higher temperatures, which he associates to the PG. The deviation of the Ef weight from linear in T behavior, according to Adam, marks the onset of another feature, which he claims is associated to local pairing. The energy scale associated to this deviation, which is above Tc but below T* (the PG onset temperature), is called Tpair.

Now Adam is showing a set of data for various UD and OD Bi2201 samples, focusing on the Ef weight at the antinode, where the SC gap is expected to be larger. He further presents several plots of this Ef weight as function of temperature for various dopings.

Q (Piers Coleman): Are the vertical lines at Tpair also extracted from resistivity? Are they associated to T*?
A: No, they do not appear in the resistivity, which only shows T*, not Tpair.

Adam argues that one can separate the Ef weight contribution due to the PG by extrapolating the high-temperature linear behavior (Wpg). The rest of the weight at the Fermi level is then associated to pairing, Wpair. Adam presents plots showing how Wpair and Wpg depend on temperature for different doping levels. He is able to scale all the different temperature-dependent Wpair measurements in a single plot, and suggests that they obey an universal scaling relation. Adam interpretation is that Tpair sets the temperature where pairs are first formed, which is rather below T*, but above Tc. To confirm his explanation, he also presented the evolution of both Wpair and Wpg across the Fermi surface.

Adam compares his ARPES data with NMR, resistivity, neutron and Nernst effect data. Specifically, he compares the phase diagrams extracted from these different techniques, and the corresponding values of T* and Tpair. He argues that neutron and Nernst data are also sensitive to Tpair, while NMR and resistivity are sensitive to T*. In Adam's picture, Tpair marks the onset of strongly phase-fluctuating SC pairs, which only acquire phase coherence below Tc. Between Tpair and T* (the PG onset temperature), there would be no pre-formed pairs. He mentions that some theoretical models are able to correctly capture the importance of these two fluctuation modes (phase and amplitude).

To finish his talk, Adam poses the question: what is the relation between his results and the checker-board order seen by STM? He compares the STM data with ARPES and argues that the pseudogap energy scales extracted from both methods are in good agreement.

Discussion

Q (Zlatko Tesanovic): Take the pairs and freeze them in a checker-board lattice, while others pairs wander around. Is the spectral signature of this configuration different than the one seen by ARPES?
A: Cannot exclude other scenarios consistent with the data, but he can certainly say that below Tpair there is local pair formation.

Q (Andrey Chubukov): The position of the peaks is not necessarily proportional to the gaps when disorder and finite lifetime are present. Explicit calculations would be interesting. He also asks Adam to compare his results with measurements from other ARPES groups, which claim to see perfect d-wave gap.
A: Both results are right, the energy scales probed are different.


Comment (Lu Yu): Emphasizes the important result that, in momentum space, the additional spectral weight starts at the end of the Fermi arcs and them grows towards the arcs.

Comment (Piers Coleman): Adam's data shows anisotropy in the momentum space. On the other hand, we heard about nematic order [Keimer's data, earlier talk], with rotational anisotropy in real space. Is there a unified picture that takes into account both real space anisotropy and momentum space anisotropy?


Q (Zlatko Tesanovic): Asks about the fact that different ARPES groups apply different symmetrization procedures to the EDCs.
A: The results presented in the talk do not depend on the symmetrization procedure.

Comment (Andrey Chubukov): Comments on Piers question and on what different experiments could be probing.


Comment (Adam Kaminski): Adam comments on the relation between nesting of the Fermi surface, the antinodes position and the observed anisotropy of the order parameter.


Q (Cecilia Ventura): [Blogger did not hear because was typing the previous questions]
A: Both ARPES and STM measurements are affected by important matrix elements.

Bernhard Keimer (MPI FKF Stuttgart): Neutron studies of the cuprates


Bernhard begins by stating that most of his talk will be spent on the YBa2CuO6+x systems

Outline:
- survey of spin dynamics in cuprates
- aspects of the electronic nematic phase
- universal picture of spin dynamics in cuprates

last 15 mins will be on BaFeCoAs2
- comparison to YBaCuO
- electronic liquid crystal phase?

The next few minutes are spent on the question why to look at YBCO. Reasons: 1) high homogeneity, no phase separation, low disorder consistent with quantum oscillations] 2) possibility to create detwinned single crystals which allows to discriminate between 1D and 2D magnetism

Next slide leads the blogger to appreciate the efforts done to obtain the experimental data - 150-200 individually detwinned crystals (no secondary phases) oriented together, and prepared for each doping level which ranges from 6.35 to 6.6 oxygen content (YBCO6.35 to YBCO6.6)

Then Keimer shows a generic phase diagram of cuprates, commensurate AF, paramagnetic, and "pseudogap" phases as well as d-wave SC with an objective in mind to look on all these phases with neutrons, 6.35 is a special point as quantum oscialltions are done recently at this level.

Now comes the data: (magnetic part of) INS response at the AFM wave vector vs omega. Two main features: Bragg (quasi-elastic) peak and inelastic incommensurate spin excitations.

We first concentrate on the quasi-elastic peaks:
large anisotropy along a and b directions, fitted perfectly with uniaxial incommensurate modulation - "spin density wave". Quotation is because Keimer distinguishes between the amplitude modulation (usual SDW) or tranverse modulation (spiral magnetic excitations) - analysis is not yet finished bu the latter is more likely. Incommensurability parameter \delta is systematically lower than in LSCO, non-zero offset in delta versus - p (doping) relation is also observed. Remarkably it is approximately concident with the onset of Tc curve on the phase diagram.

Critical comparison with muSR data comes next: muSR sees static IC magnetic order with a lifetime \geq 1 microseconds, disappears above 2-5 K. The quasielastic peak seen in neutrons is consistent with that but the temperatures are different, the peak diappears above 40K. What helps? - To improve the resolution ( we now move to spin-echo spectroscopy with a resalution of 1 \mu eV as compared to 100\mu eV in usual triple axis spectroscopy) . The narrowing of the quasielastic peak to the experimental resolution at 5K (onset of the real SDW transition) compares well with muSR data. Piers raises an issue on the temp. dependence of the linewidth and whether Bernhard is able to say on the power law of this dependence (looks quadratic), Reply: the quality of the data is not enough to say definitely at present.

The conclusion of the data presented to far: incommensurate SDW transition at T=0 is a feature below the superconducting dome on the underdoped side - consistency with quantum oscillation measurements.

The next remark concerns the bahavior of the quasielastic incommensurate peaks which enhance in presence of the magnetic field showing strengthening of the SDW phase. This is overall qualitative agreement with a theory argument by Mooon and Sachdev phase diagram, PRB 2009, and Demler et al PRL 2001.

The fact that small pockets in quantum oscillations are seen at higher doping where INS sees no sign of SDW is interpreted in view of much smaller magnetic fields used in INS as compared to quantum oscillation measurements.

Now we move to the incommensurate response and the nematic phase - higher doping on the underdoped side, no quasielastic peaks (no SDW) but there is still an incommensurate response. A peculiar feature of this part of the phase diagram is spontaneous onset of incommensurability in the INS spectra upon cooling below 150K. The main fact is that orientational symmetry is broken without and static magnetic order and the translational symmetry is still preserved.

From a theory perspective it looks as electronic analog of nematic liquid crystal. (Fradkin, Kivelson). Possible routes towards nematicity includes Pomeranchuk instability, (Hallboth and Metzner PRL 2000, Yamase and Kohno, JPSJ 2000). Again worth to say that the onset of the nematicity is seen in INS. This is consistent with a resistivity anisotropy along a and b directions found by Ando et al at similar temperatures. Kapitulnik comments on the temp dependence of the resistivity at 200K and its consistency with his measurements (Kerr effect) and INS.

Next slide shows the q-map of the spin excitations with elliptic shape (broken orientation symmetry), analysis shows that the data can be described in terms of (nematic) order which occurs around 150K and is doping dependent (150K - O6.45, 175K-O6.5, 200K - O6.6).
Again the data are consistent with the Nernst effect except for a slight discrepancy with regard to the onset temperature.

Interesting remark on the onset of superconducting instability deep inside the nematic phase: based on the the c-axis optical conductivity data and the formation of the Josephson plasmon mode which is referred to the onset of phase incoherent superconductivity in a bilayer.
The nematic transition coincides with the onset of phase-incoherent superconductivity within bilayer unit. Kapitulnik and McKenzie comment on the similar measurements in BSSCO where simialar results have been found. Nevidomoskii raises a technical question of how the points on the phase diagram coincide with the original data of the optical conductivity and the observation of the plasmon peaks. Reply concerns with the coupling of the plasmon mode to the c-axis phonons and the anomaly associated with that. Lu raises an issue whether incommensurate SDWs are spiral or amplitude, the reply is that it is mostly likely spiral.

Now we see the spin excitations - nearly gapless, hour-glass type dispersion. However, in contrast to the previous talks the blogger heard, here there are two (or even three?!) types of the hour-glass (or sometime called X-shape) dispersion on the phase diagram: "open hour glass" - never closes at pi,pi point (undoped LSCO or underdoped YBCO (6.45)). signature of coexisting nematic phase with low-Tc superconductivity which gaps the low energy part of the "hour-glass"-shape.

Spin excitations in the d-wav SC in YBCO reveal a resonance mode with closed "hour-glass" shape below Tc [well understood within RPA type theories, see Eremin et al., PRL (2005)]. transforms into open "hour-glass" shape above Tc.
Next slide discusses the role of Zn impurities which according to Keimer restore IC-SDW, evidence for nearby QCP.

Summary: spin dynamics in cuprates uncovers: (a) spin wave excitations (AF), (b) paramagnons (overdoped phase), gappless open hour-glass (underdoped, pseudogap), gapped open hour-glass (pseudogap+SC), closed hour-glass (d-SC) phase

Then Keimer briefly flashes the new data on the high-energy excitations as measured by resonant inelastic x-ray scattering: sharp signatures of the dispersive spin excitations in the strongly overdoped cuprates (lie exactly on the same curve as in the underdoped cuprates, consistent with the same energy scale in the whole family of cuprates.

NOW ferropnictides: BaKFeAs crystals, quick flash of the resonant spin excitations below Tc, signature of sign-changing order parameter. anisotropy of the spin excitation along (pi,pi). Is that a signature of the nematic phase? The answer is no as the in-plane anisotropy of the data is well described within RPA and the band structure calculations, Inosov et al, arxiv:1007.3722v2.

Questions: blogger raises an issue of the nematicity in BCFA and cuprates and in particular whether the LDA-based calculations were done for the spin excitations also in YBCO.
Raphael raises a concern on the use of nematic order in applictaion to the pnictides. His statment is that the Ising nematic order in pncitides is magnetic in origin thus will not yield an electronic anisotropy. Reply: Keimer agrees but raises an issue of the electron nematic in the doped samples and not in the undoped magnetically ordered ferropnictides.

Rick Greene (Maryland): Correlation between spin fluctuations and pairing in electron-doped cuprates

Greene started by comparing electron- and hole-doped cuprates (or n- and p-doped, respectively). There is by now an enormous amount of phenomenology on these systems and some of the main features and theoretical ideas that surround them are reviewed for RMP by Greene and collaborators in arXiv: 0906.2931. He stressed that the main issues in the field are now revolving around the nature of the so-called pseudogap state in the hole-doped cuprates: Is it a phase-fluctuating superconductor or a competing ground state of some other symmetry? These issues have their echoes in electron-doped cuprates. For example, is there a pseudogap state at all in n-doped cuprates? Greene’s Nernst effect measurements show very small region of phase fluctuations, far smaller than what is seen in hole-doped cuprates by Ong et al.

He illustrated some of these issues by referring to an earlier talk by Kapitulnik and acknowledged that there might be some time-reversal symmetry breaking in n-doped cuprates as well but there does not seem to be evidence for this actually taking place. However, he stressed that, while there well might be an unknown order parameter competing with superconductivity in the pseudogap state of p-doped cuprates, in the n-doped materials it is the 2D AF spin fluctuations that are the main culprit involved in interplay with superconductivity. Greene then showed old Greven’s data illustrating the phase diagram of n-doped materials as strongly supporting this view. The antiferromagnetic (AF) state is rapidly suppressed as it approaches the superconductor (SC) but some coexistence is possible and perhaps indicated in other experiments. Coleman asked whether the considerably different behavior of n- and p-doped cuprates might be related to the different location of the doped electrons (holes): in hole-doped systems, the holes go to oxygen sites and form Zhang-Rice singlets around neighboring copper atoms, while the doped electrons simply go straight to coppers, into their so-called “upper Hubbard band,” most likely the d_x^2-y^2 orbital. The answer is “yes.”

More review of the various data followed: the Hall effect seems to know about the SC transition. Optical conductivity does see the opening of the SC gap. AF correlation length drops precipitously near the SC. There are very detailed ARPES data (Armitage et al) showing well-developed Fermi surface. AF state tends to be commensurate, in contrast to a typically incommensurate AF that is formed in hole-doped cuprates. Such commensurate AF results in the reconstruction of the Fermi surface and various small electron and hole pockets are formed (similar to what is seen in newer iron-pnictide SC) in the underdoped regime. Both the reconstructed and the original large Fermi surface in the overdoped regime have been seen in SdH oscillation experiments, but the small electron pockets seem to be missing. Various weakly and more strongly correlated SDW theories have been used to explain the data [Amicus Bloggerius: The Hall coefficient (at 300mK) vs doping was done in the normal state (H>Hc2) and showed a kink at a doping near Ce=0.17. This is a slightly overdoped composition (optimal doping is 0.15 in PCCO). Nothing unusual is seen at the doping near Ce=0.14 where Greven claims the LRO AF disappears. The Hall data is consistent with a FS reconstruction at this doping, Ce=0.17. The optics measures the opening of a partial gap in the ab plane optical conductivity at T*. As a function of doping this “normal state gap or pseudogap” disappears near Ce=0.17, thus being consistent with the Hall data and the ARPES and the quantum oscillation experiments and the onset of magnetic fluctuations in Greven’s work.]

Greene then moved to the resistivity experiments and his data. There are some interesting developments here: the goal is to carefully examine various resistivity fits that have appeared in the literature (Taillefer’s analysis of data on various SCs suspected of being associated with spin fluctuations is mentioned here). Should one fit resistivity to the form like \rho = \rho_0 + A(x)T + B(x)T^2 + C(x)T^n or should different T-dependencies be considered separately? Kapitulnik remarked from the audience that often a guiding theoretical model decides when we should consider them all together; for example, when separating the Fermi liquid electronic contribution from the one due to phonons. Greene’s old resistivity data (Fournier et al) shows linear T behavior near AF, on the underdoped side. Flint asked whether finite H experiments were done to see what happens to the AF state; at that moment, Greene was not aware of any that would be relevant here but later recalled neutron scattering experiments cited in their RMP. Then, he showed a change in behavior from T^2 near the SC state to T^\beta with \beta < 2 on the AF side. In between, there is a linear behavior, apparently associated with the quantum critical (QC) point. There is also an upturn in resistivity on the AF side. Chubukov asked whether the AF state might be extending further into the optimally and even overdoped regime of the phase diagram. Greene said the situation was not entirely clear but he did stress that many viewed reports of coexistence between AF and SC as less than firmly established, and likely due to various alien phases. Sachdev’s recent phase diagram of SDW + SC states was shown. [Amicus Bloggerius: The T^2 resistivity is seen at low temperatures in a 10T field above the 0.17 doping. Data looks like the funnel phase diagram expected near a QCP. The issue of coexistence of SC and AFM at doping between 0.13 and 0.17 is not really resolved at this time because of possible sample quality issues among the different groups that have done neutron scattering experiments.]

Next, very recent data were presented. Greene explained why he viewed the separate analysis of different T power laws as a better way of approaching the data. Questions were asked and answered here concerning the reliability of the AT + B^T^2 fits done by others in p-type cuprates. Greene observed that in their new data that connects resistivities of different n-doped cuprates one has to contend with the uncertainties in the doping levels of different chemically doped materials. There is little one can do about this except to assume that the optimal nominal doping levels correspond to the same actual doping; this is suggested by the similarity of Hall effect data, both magnitude and T dependence. When looking at the overdoped systems, they see linear T behavior as well. It appears that the coefficient A is associated with the superconducting Tc and vanishes at the same doping. After that, only T^2 term is left, with finite B(x) coefficient. Greene suggested that A should be associated with the scattering mechanism, probably some form of spin fluctuations that are also responsible for SC. A lively debate followed, focusing on the relation, if any, with the observed linear behavior in the regime near the QC point.

In their data, the application of finite magnetic field H suppresses both SC and the regime over which the linear term is present in the resistivity. Greene also remarked that \rho_0 is pretty big and thus the materials are quite dirty compared to finest YBCO crystals, although still in the range of LSCO. The full phase diagram was inferred, including the effect of H (see picture). The audience found this very interesting and many questions and comments followed. Blumberg asked whether the finite H resistivity could be associated with the flux flow in the mixed state, along the lines of the recent experiment by Boebinger et al. Probably not. Also, Nernst data are not available at this time. Buehler-Paschen asked how reliable are the fits. \rho_0 is fixed in the fitting procedure. There is also a linear magnetoresistance which is not understood at the moment. Aronson asked about specific heat data. Not possible, answered Greene, these are films. Takagi asked about contribution of spin fluctuations to resistivity. Keimer inquired about the quality of their n-doped materials (by now, p-doped crystals are extremely good for YBCO, although the ones of BSCCO and LSCO are not any better than n-doped cuprates). Greene responded that materials are very good based on x-ray diffraction.


Blogged by Zlatko Tesanovic.